Dashboard
Navigation: Dashboard
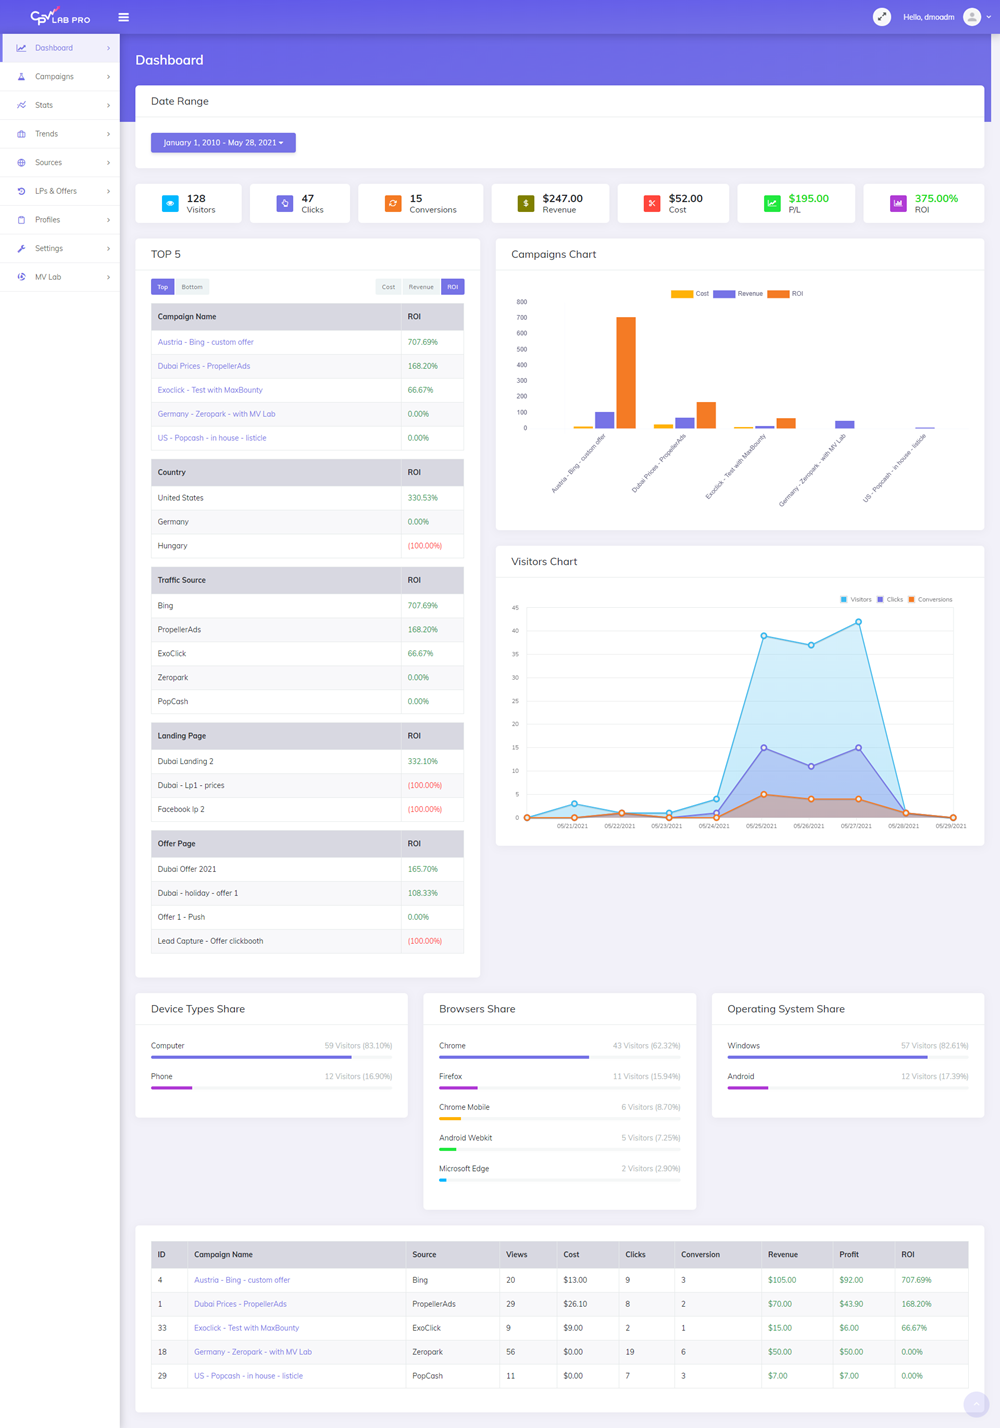
The Dashboard shows a summary of the most important information from your campaigns.
Page fields and details
The page is structured in a few important sections:
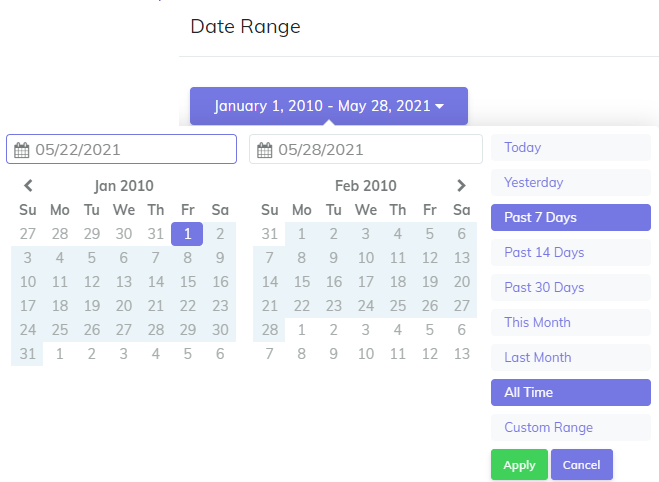
1. Date Range
- Date Range - from here you can pick the time period for the information displayed next
- Usually this is setup for the current week or the current day
2. Metrics
- The Metrics section contains 7 important metrics which will show an overview for all your campaigns.
- All the information is for the period selected in the Date Range field:
- Number of visitors
- Number of Clicks
- Conversions
- Revenue Value
- Cost Value
- P/L
- ROI

3. TOP 5
- The Top 5 Section includes 5 data tables with an overview of the top 5 most performing or less performing : campaigns, countries, Traffic Sources, Landing Pages and Offers
- For each Data table you can view the Cost, Revenue or ROI
4. Campaigns List Chart
- This chart is a visual display of the information showing in the TOP 5 campaigns data table
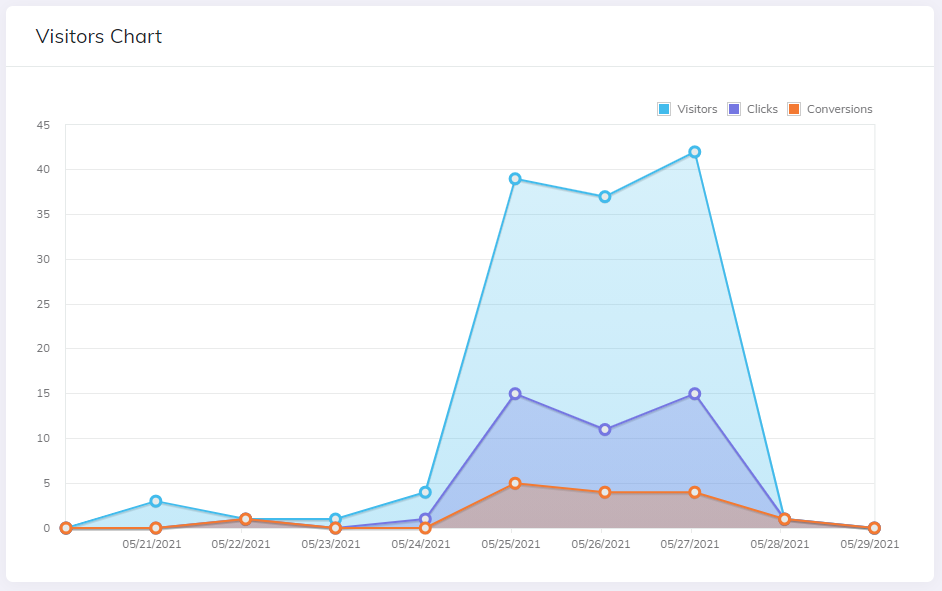
5. Visitors Chart
- This graph is a visual representation of the Visitors coming to the Top 5 campaigns in the period selected as Date Range.
- This chart will help which day/hour brought more visitors
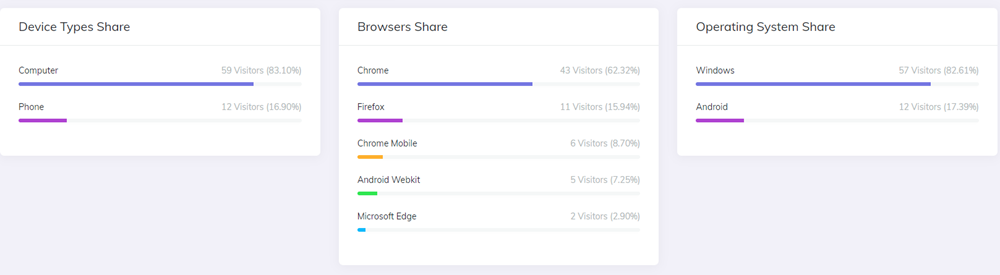
6. Visual Share Charts
- There are 3 charts available in this section
- Device Types - showing the type of the devices used when accessing the campaigns
- Browsers - the browsers used
- Operating System - the operating systems used by the visitors
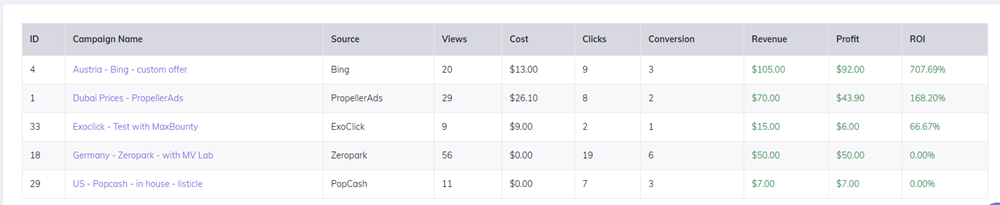
7. Top Campaigns Overview
- this section includes a data table showing an overview with he most important metrics for the top 5 Campaigns
You may also find useful: