Drill Down Stats
The DrillDown report is a report that allows grouping data on 4 different levels.
From here you can check the performance of your campaigns by grouping the data by country, city, age, mobile device, pages, etc.
You can also export the data about your campaign performance into a CSV file and play with it.
Video on how to use the DrillDown report
Video Tutorial for using the Drill Down report in CPV Lab | CPV One (opens new window)
Navigation: Stats ➡️ Drill Down Stats
A. Page fields and details
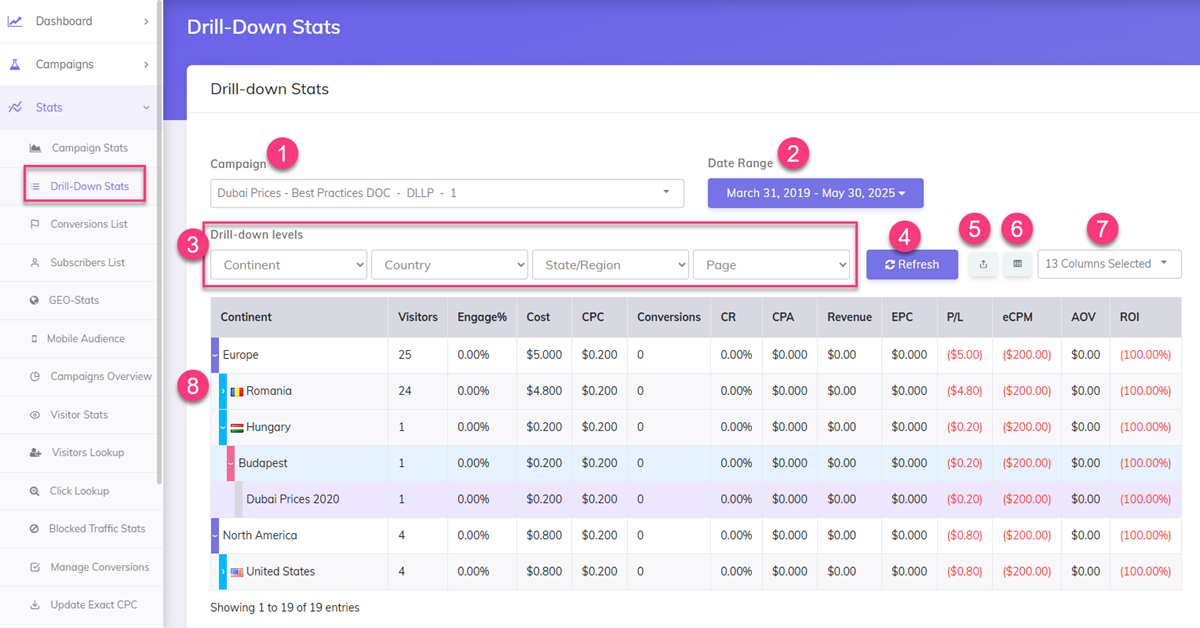
Drill down Stats is a report that is showign the information about each campaign in an easy to read format, on 4 levels.
1. Campaign
- Select a Campaign for which you want to View Stats in a DrillDown format
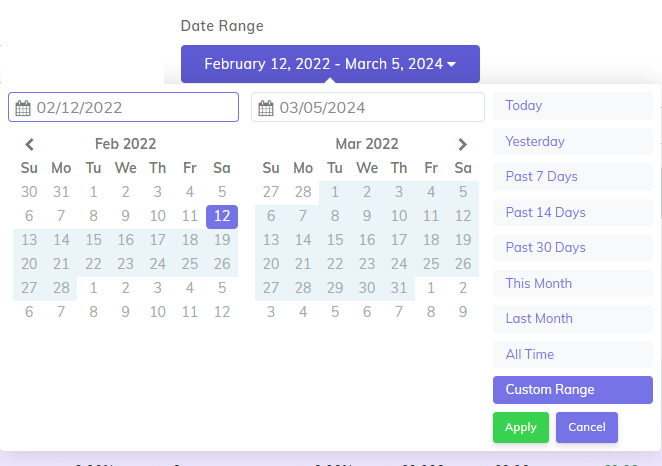
2. Date Range
- Enter a Date Range or Select a Preset Interval to filter your data.
- it can be today, last week, last month or any interval you want
3. Drill Down levels
- there are 4 drowdowns from which you can pick how you want your data to be grouped (4 levels)
- once a value is picked from the first dropdown, that column will no longer be available in the next dropdowns
For example:
- first level -
keyword - second level -
landing page - third level -
offer - fourth level -
country
For this example you will get:
- level 1 - information grouped by keyword
- level 2: the information for that keyword is split by landing page
- level3: the data for each landing page is split by offer
- level 4: for each offer you can see the data split by country
- level3: the data for each landing page is split by offer
- level 2: the information for that keyword is split by landing page
4. Refresh
- This button allows you to refresh the report data after you change your columns selection for the drill down.
5. Export to CSV
- This will allow you to export the data in a CSV format.
- With the data exported, you can create pivot tables or other reports
6. Export to Pivot Table
- This button will download the data from the report in a Pivot Table report file
- All the levels selected in the "Drilldown" report will be preselected in the export.
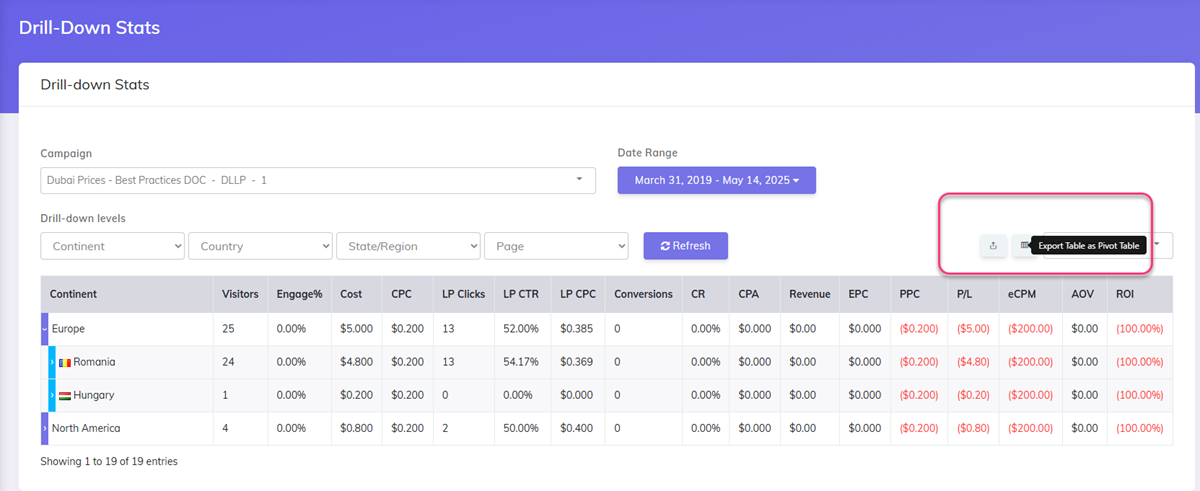
And here is an example of export to Pivot Table:

7. Columns selected
- from this dropdown you can pick the rest of the columns that you want to be displayed in the report (apart from the ones selected for drilldown)
8. Report
- The Drilldown report will show first the data collapsed.
- Once you click the
+for each row the row will expand
Other Stats you may also find useful: