Traffic Insights Report
Navigation: Sources ➡️ Traffic Insights
Traffic Insights is a report where each metric is calculated based on the traffic source and the time period selected for it.
- On the Traffic Insights page you can:
- See aggregated data for all your different traffic sources
- Compare data (costs, revenue, etc) between traffic sources
- Check the data for your team members
Page fields and details
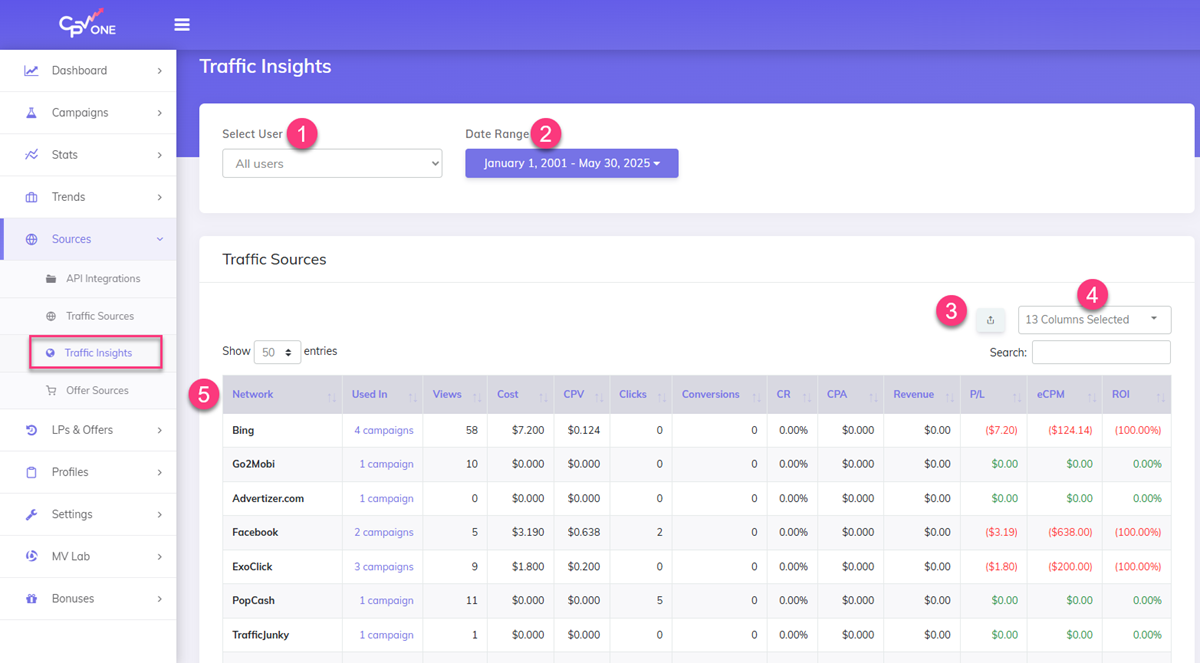
1. User filter
- The User filter allows filtering the data showing in the report based on the user
- this means that if you have multiple users - you can filter the data and see the metrics for each traffic source that user is using.
Example:
- if user 1 has campaigns using Facebook Ads, Google Ads and NewsBreak Ads:
- then the report will show the metrics for these traffic sources for ** the selected users campaigns**
- if "All users" is selected:
- then the report is done based on all the campaigns, for all users.
2. Date Range
- With the "date range" you will select the interval of time for the metrics to be calculated.
Example:
- If you choose "last week":
- then the metrics will be calculated based on the results the campaigns had last week
- If you choose "Current month":
- then the metrics showing in the repot will be for the traffic and the campaigns results in the current month
3. Export to CSV
- Download the report with traffic source insights into a CSV file
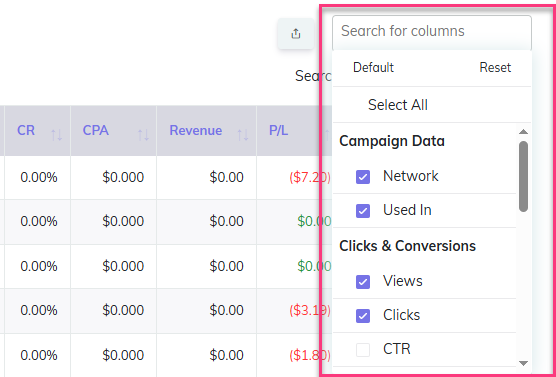
4. Columns Visibility
- Select what columns you want to see in the report
- You have the main columns, based on which data is grouped: Traffic Source, Used Id (showing in how many campaigns this ad network is used)
- And then you have the metrics you want to see in the report.
5. The report
- The Traffic Insights report will show the valuable metrics for each traffic source used in your campaigns.
Video Tutorial for using the Traffic Insights report (opens new window)
You may also find useful: